XML-RPC, in case you aren’t living in the early 2000s, is a remote procedural call (get it?) that encodes its HTTP returns in XML. It has been largely replaced with RESTful APIs, but it still exists. The two places I’m personally aware of are rtorrent, and Wordpress. The former I lived with, mainly because nothing was exposed to the internet; the latter I wasn’t aware of until today. I thought I had been the victim of a DoS attack using it as a vector but (SPOILER) I don’t believe that to be the case.
As a refresher, this site runs on Wordpress, in a Docker container, on AWS Lightsail. Each site (currently four) gets its own MariaDB and WP container, and compose handles their instantiation. Two of them (this one and my tech consulting site) get their domain and DNS handled by Google, the other two have their domains at Namecheap, and DNS handled by Cloudflare. Given that Cloudflare hands out SSL for free (the primary reason why I moved DNS over to them from Namecheap), without the hassle of ACME, I’ll probably be shifting everything to them. When I do so, I’ll be able to simplify the site’s creation some, as it won’t need to be dealing with certs.
This afternoon, my wife texted me that her site (shameless plug for Austin-area baked goods) was down. Huh, sure is. Lemme try ssh’ing into the server and… oh, that’s not good. Cloudflare isn’t showing any issues on its end. AWS isn’t showing any service disruptions. Reboot the instance!
I’ll fast-forward a bit and say that rebooting it did work, but it took longer than I expected to go down and up. I suspect Amazon tries to do a polite reboot, and given the limited hardware resources and OOM errors the server was having, it took a while to come back.
First things first, why didn’t I receive an alert? After all, I work for a monitoring company, and I set it up to monitor all my stuff. Turns out it helps when you give the alerts somewhere to go, like your phone. Whoops.
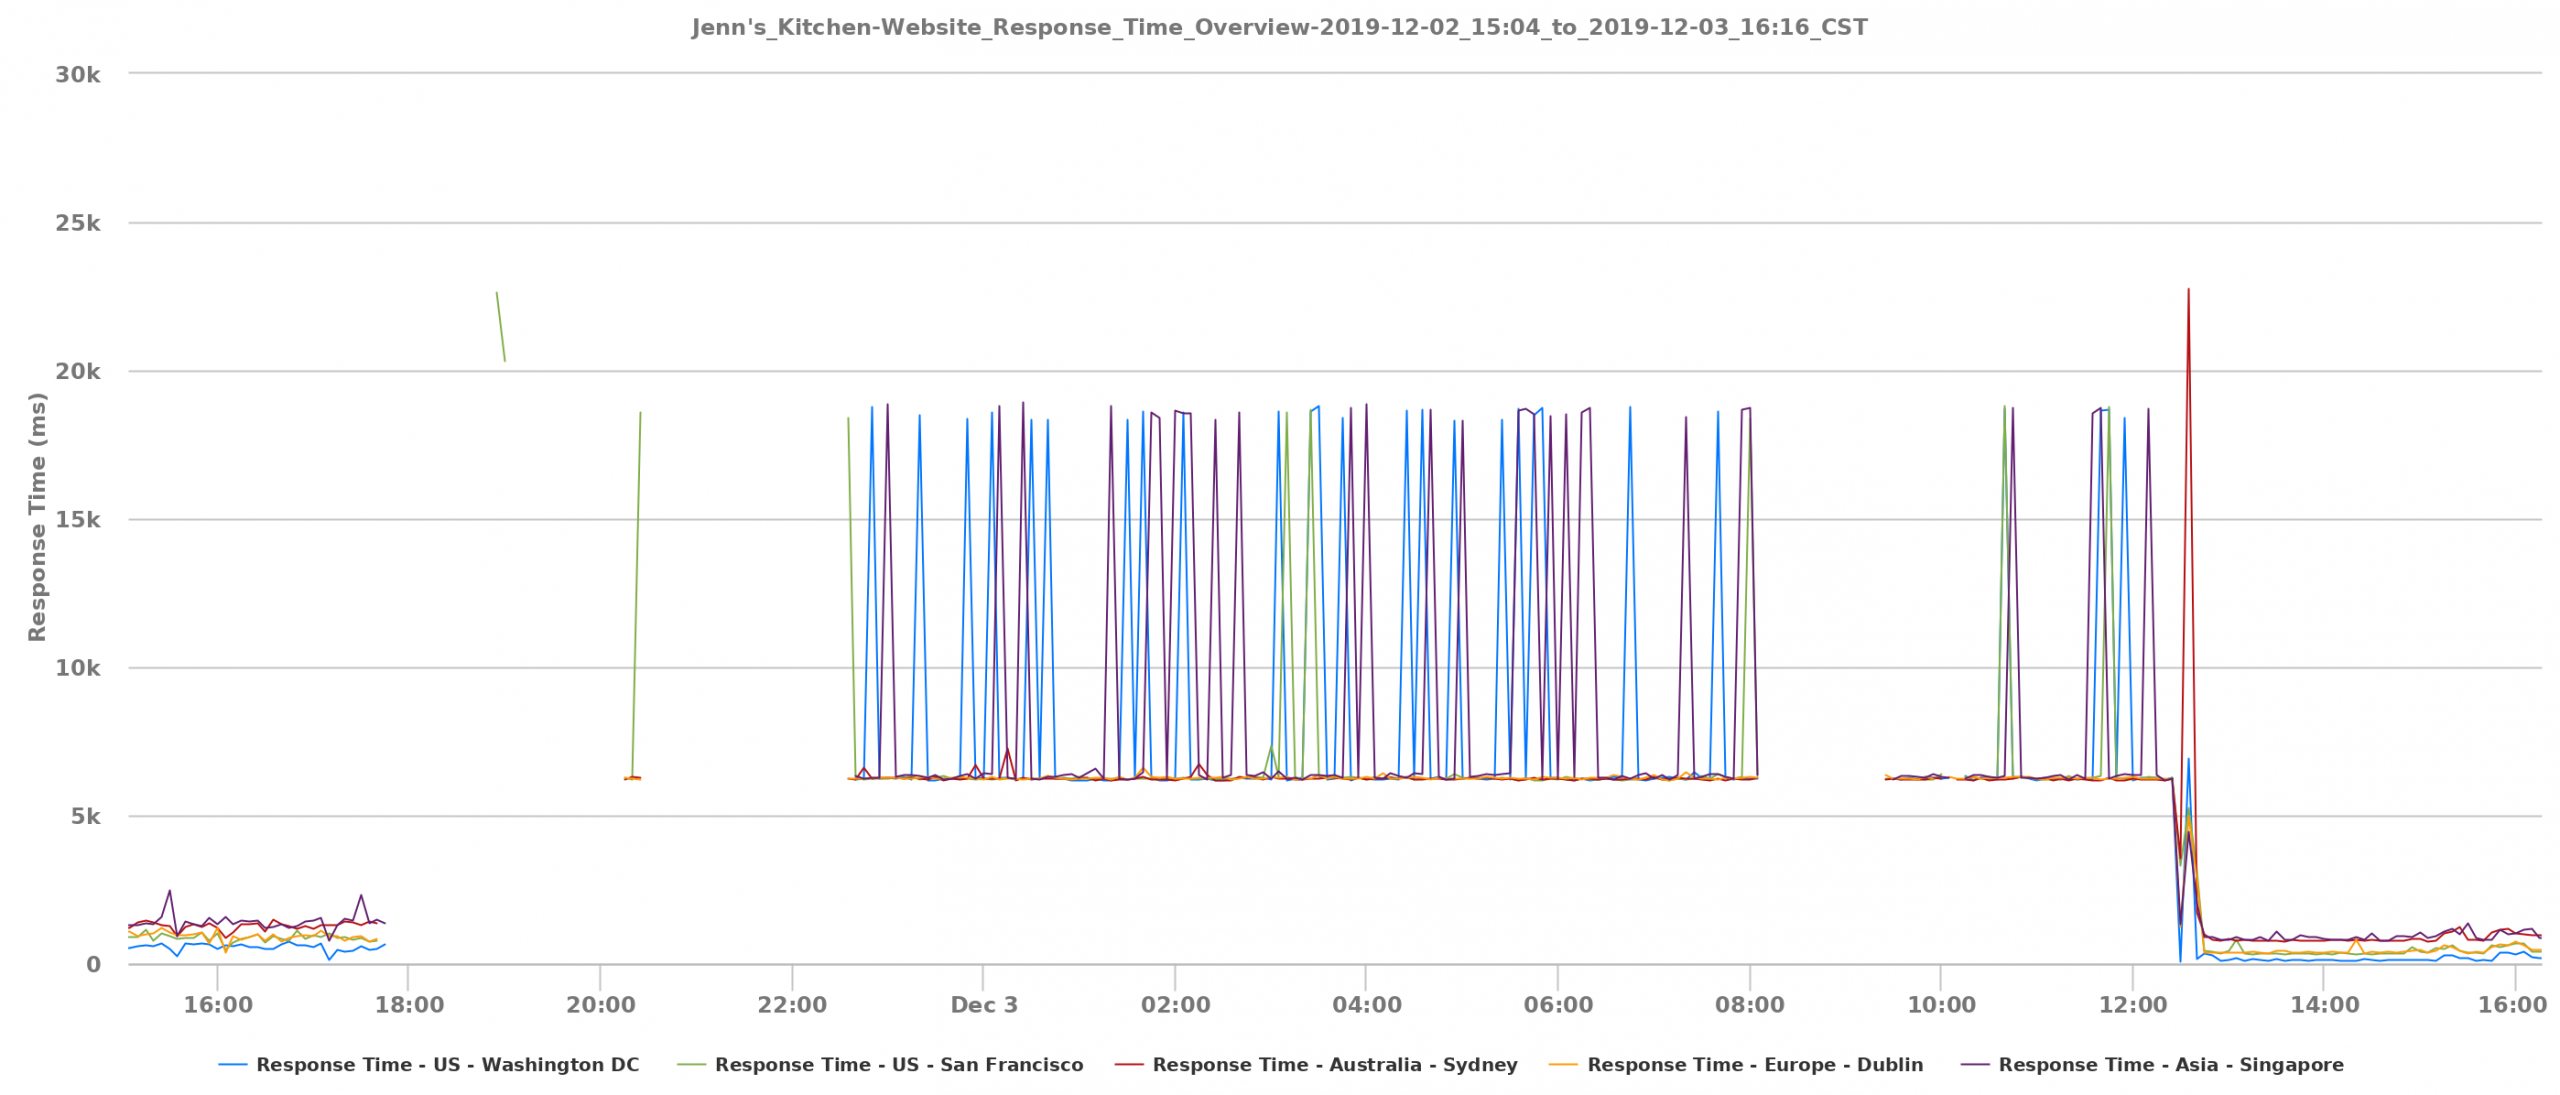
Outage duration: 18 hours, 49 minutes and 31 seconds. There goes my three nines.
Response time wasn’t consistently horrible, which is interesting.
Everything’s up, let’s go log hunting.
# I use zsh, but I'll use $ to denote an entered command
$ docker logs wp_jenn

# Times are in UTC
172.19.0.2 - - [02/Dec/2019:23:50:36 +0000] "GET / HTTP/1.1" 200 5624 "-" "LogicMonitor SiteMonitor/1.0"
172.19.0.2 - - [02/Dec/2019:23:50:29 +0000] "GET / HTTP/1.1" 200 5624 "-" "LogicMonitor SiteMonitor/1.0"
172.19.0.2 - - [02/Dec/2019:23:52:39 +0000] "GET / HTTP/1.1" 200 5624 "-" "LogicMonitor SiteMonitor/1.0"
172.19.0.2 - - [02/Dec/2019:23:50:40 +0000] "POST /xmlrpc.php HTTP/1.1" 200 465 "-" "Mozilla/5.0 (X11; Ubuntu; Linux x86_64; rv:62.0) Gecko/20100101 Firefox/62.0"
172.19.0.2 - - [02/Dec/2019:23:51:41 +0000] "GET / HTTP/1.1" 200 5624 "-" "LogicMonitor SiteMonitor/1.0"
172.19.0.2 - - [02/Dec/2019:23:56:45 +0000] "GET / HTTP/1.1" 500 2953 "-" "LogicMonitor SiteMonitor/1.0"

# An xmlrpc POST, followed shortly by an HTTP 500?
# A script kiddie! (EDIT: See addendum at end of post)
# Let's dig deeper.

$ docker logs db_jenn

2019-12-03  1:21:11 14704 [Warning] Aborted connection 14704 to db: 'db_jenn' user: '$user' host: 'nnn.nnn.nnn.nnn' (Got timeout reading communication packets)

# OK, Wordpress lost db connection. Why?

2019-12-03  1:24:23 0 [Warning] InnoDB: A long semaphore wait:
--Thread 140597443700480 has waited at trx0trx.cc line 283 for 271.00 seconds the semaphore:
Mutex at 0x55acfa33bb50, Mutex TRX_POOL created trx0trx.cc:279, lock var 0

# Hmm... that doesn't have anything to do with XML-RPC.
# Let's double-check by looking at nginx logs.
# $ docker logs nginx
null
# Weird.

$ docker exec -it nginx /bin/bash
$ ls -lah /var/log/nginx
access.log -> /dev/stdout

# Ah. Well...

# EDIT - see new "Things I learned"
$ docker logs --details --since 2019-12-02T23:45:00 --until 2019-12-03T01:00:00 nginx
 nginx.1    | atxadvantage.pro 172.68.144.201 - - [02/Dec/2019:23:46:38 +0000] "GET / HTTP/1.1" 200 7951 "-" "LogicMonitor SiteMonitor/1.0"
 nginx.1    | atxtechtoyou.com 52.0.173.190 - - [02/Dec/2019:23:46:44 +0000] "GET / HTTP/1.1" 499 0 "-" "LogicMonitor SiteMonitor/1.0"
 nginx.1    | atxadvantage.pro 108.162.249.134 - - [02/Dec/2019:23:47:12 +0000] "GET / HTTP/1.1" 504 167 "-" "LogicMonitor SiteMonitor/1.0"
 nginx.1    | 2019/12/02 23:47:12 [error] 44#44: *142095 upstream timed out (110: Operation timed out) while reading response header from upstream, client: 108.162.249.134, server: atxadvantage.pro, request: "GET / HTTP/1.1", upstream: "http://172.19.0.5:80/", host: "atxadvantage.pro"
 nginx.1    | jenn.kitchen 108.162.249.168 - - [02/Dec/2019:23:47:13 +0000] "GET / HTTP/1.1" 200 5271 "-" "LogicMonitor SiteMonitor/1.0"
 nginx.1    | sgarland.dev 52.49.248.100 - - [02/Dec/2019:23:47:33 +0000] "GET / HTTP/1.1" 499 0 "-" "LogicMonitor SiteMonitor/1.0"
 nginx.1    | sgarland.dev 52.0.173.190 - - [02/Dec/2019:23:47:53 +0000] "GET / HTTP/1.1" 499 0 "-" "LogicMonitor SiteMonitor/1.0"
 nginx.1    | sgarland.dev 52.62.46.109 - - [02/Dec/2019:23:47:54 +0000] "GET / HTTP/1.1" 499 0 "-" "LogicMonitor SiteMonitor/1.0"
 nginx.1    | 2019/12/02 23:48:23 [error] 44#44: *142106 upstream timed out (110: Operation timed out) while reading response header from upstream, client: 172.68.141.126, server: jenn.kitchen, request: "GET / HTTP/1.1", upstream: "http://172.19.0.11:80/", host: "jenn.kitchen"

# Not much help - the 499 code means the client closed the connection

# Looking through /var/log/kern.log, there are a lot of mysqld blocks
# and one jbd2/xvda1 blocked, indicating disk writes couldn't occur

$ grep -i blocked kern.log.1
Dec  3 00:44:01 ip-172-26-14-104 kernel: [784684.000073] INFO: task jbd2/xvda1-8:148 blocked for more than 120 seconds.
Dec  3 00:44:03 ip-172-26-14-104 kernel: [784684.022132] INFO: task cron:457 blocked for more than 120 seconds.
Dec  3 00:44:05 ip-172-26-14-104 kernel: [784684.039797] INFO: task rs:main Q:Reg:480 blocked for more than 120 seconds.
Dec  3 00:44:06 ip-172-26-14-104 kernel: [784684.057792] INFO: task mysqld:17913 blocked for more than 120 seconds.
Dec  3 00:44:08 ip-172-26-14-104 kernel: [784684.075770] INFO: task mysqld:3600 blocked for more than 120 seconds.
Dec  3 00:44:09 ip-172-26-14-104 kernel: [784684.093249] INFO: task mysqld:16119 blocked for more than 120 seconds.
Dec  3 00:44:11 ip-172-26-14-104 kernel: [784684.325147] INFO: task mysqld:16193 blocked for more than 120 seconds.
Dec  3 00:44:12 ip-172-26-14-104 kernel: [784684.344579] INFO: task mysqld:16262 blocked for more than 120 seconds.
Dec  3 00:44:12 ip-172-26-14-104 kernel: [784684.363048] INFO: task mysqld:16269 blocked for more than 120 seconds.
Dec  3 00:49:20 ip-172-26-14-104 kernel: [785046.496128] INFO: task kworker/0:1:15959 blocked for more than 120 seconds.

# There is also an oom message from mysqld
# Note that the timestamp on this was much later
$ grep -i child kern.log.1
Dec  3 14:18:32 ip-172-26-14-104 kernel: [833588.338416] Out of memory: Kill process 1267 (mysqld) score 72 or sacrifice child
So what was it? As near as I can tell via much Googling, it was caused by InnoDB Adaptive Hash Index, a setting which may or may give performance benefit for larger databases, but has caused enough problems that as of MariaDB 10.5, it’s been disabled. Sadly, 10.5 is still alpha, and although none of these sites are mission-critical, I’d rather not do alpha testing.
XML-RPC, although a security concern (and indeed, I’ve since disabled it, since I don’t use WP’s mobile app, the only thing I can find that uses it still), was not the problem. The few POSTs I saw might have been script kiddies, maybe a bot, but it’s hard to say without nginx logging.
Until MariaDB 10.5 hits stable, I’m adding a new config file to my db containers. MariaDB searches for config files in multiple locations, and applies each change consecutively, so by adding this to /root/.my.cnf, it will be added last, and not interfere with the default /etc/mysql/my.cnf config file. Whether or not this was the problem remains to be seen, but for now it’s my best guess, and I’ll keep monitoring.
# /srv/www/.my.cnf
[mysqld]
innodb_adaptive_hash_index = 0

# docker-compose.yml
- /srv/www/.my.cnf:/root/.my.cnf

# In each wordpress folder in the Lightsail site, do:
$ docker-compose stop db && docker-compose up -d db

# Verify with:
$ docker exec -it db_jenn mysqld --verbose --help | grep innodb-adaptive-hash-index
...
innodb-adaptive-hash-index                                 FALSE
Things I learned:
- Much like backups, if you haven’t checked your alerting, you don’t actually have monitoring.
- Don’t get sucked down rabbit holes.
- Docker images frequently have logging disabled/redirected, realize that limitation going in if you haven’t modified them.
- NEW: For whatever reason, I didn’t think to look at the nginx logs with docker logs. In any case, nothing useful was found.
Addendum
Since writing this post, the sites crashed again, although at least I was immediately alerted thanks to LogicMonitor. It’s clear after further research that the XML-RPC was a red herring, and was intrinsic to WordPress itself. I now see many AH01797 errors in logs as it is unable to connect. This is fine, as I don’t use the functionality, and it’s one less security hole to worry about.
At this point, my best guess is that the 512 MiB of RAM is inadequate for four WordPress instances, even with 1 GiB of swap. A quick look at free -h shows that to probably be the case, with single-digits available much of the time. The instance is perfectly snappy for most work, but then occasionally craps out. This may be due to some WordPress cronjobs.
I’m going to look more into some performance tuning options, but I may have to either transition away from WordPress to something like Hugo, or upsize the instance.